Key takeaways
- How to calculate SOM: Count the customers you can realistically close in 3 years, from your sales capacity rather than a hopeful percentage, and multiply by your yearly price. Keep it under 25% of SAM.
- How to calculate SAM and TAM: SAM is the customers you can reach today times your yearly price. TAM is everyone who could ever buy, worldwide. A believable SAM sits between 1% and 50% of TAM.
- Credibility wins: A sourced $2M SOM beats an unsourced $5B TAM. Put the source and the year next to every figure on the slide, and make sure the figure is on the page you cite.
- Free counting sources: The US Census Bureau for company counts by size and industry, and Crunchbase for startups.
Customers you can reach, times your yearly price, equals your SAM, not your SOM. Mix those two up and your market slide falls apart in front of anyone who has sized a market before.
Below: how to calculate TAM, SAM, and SOM bottom-up, two honest ways to land your SOM, and the ratio checks I built into Preuve to catch a funnel that doesn't add up. You won't need a $2,000 analyst report.

Will your idea survive the market?
Preuve AI runs 10 agents against live market data and links every claim to a source. Free analysis in 60 seconds.
What is Market Size? (TAM, SAM, SOM Explained)
Market size breaks into three layers. Each one answers a different question.
TAM (Total Addressable Market)
Everyone who could theoretically buy your product if you had unlimited resources and zero competition.
Formula: everyone who could ever buy, worldwide × average yearly price
Example: "All businesses that need project management software" = ~$10B globally
SAM (Serviceable Addressable Market)
The part of TAM you can actually reach with your current business model, geography, and way of selling.
Formula: customers you can reach today × your yearly price
Example: "US small businesses already paying for cloud tools" = ~$2B
SOM (Serviceable Obtainable Market)
The slice of SAM you can realistically win in the next 1 to 3 years with the team and money you have.
Formula: customers you can close in 3 years × your yearly price
Example: "US small businesses ready to switch from Asana to a cheaper tool" = ~$50M
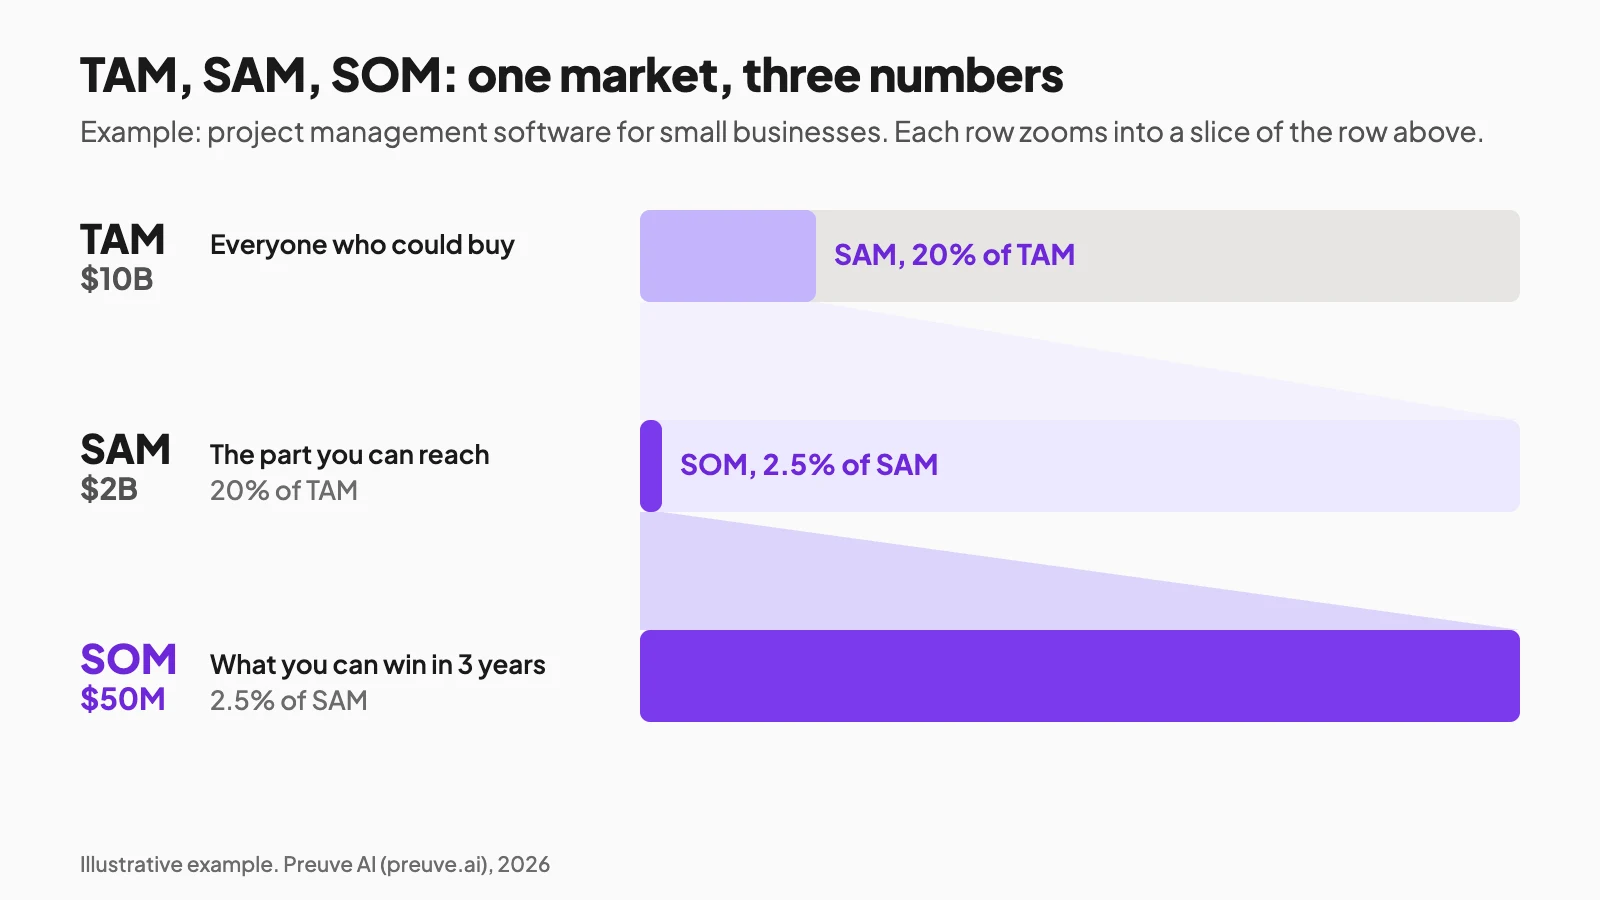
Investors care most about SOM. TAM is context. SOM is what you're fighting for, and it's the number they will push on.
Why Most Market Size Calculations Are Wrong
Three common mistakes kill credibility:
Top-down fantasy
"The global SaaS market is $200B. If we get 0.1%, that's $200M."
This is not analysis. It's wishful math. You can't work backwards from a giant number and call it a market size.
Ignoring competition
Your SAM isn't "everyone who needs X." It's "everyone who needs X and would realistically consider you over what they use today."
If Notion, Asana, and Monday own 80% of your target segment, your real SAM is the remaining 20%.
Confusing TAM with opportunity
A $50B TAM means nothing if your SOM is $5M. Investors know this. They'll ask: "What can you actually capture?"
How to Calculate Market Size (Step-by-Step)
Method 1: Bottom-Up (Recommended)
Start with your customer, not the industry. I'll use one example all the way through: a $99 a month tool for small software companies.
Step 1: Define your ideal customer
Be specific. Not "businesses" but "US software companies with 10 to 50 employees that sell to other businesses."
Step 2: Count them
Use LinkedIn Sales Navigator filters, Census Bureau business counts, or Crunchbase. Write down where the count came from, because that line is what makes the number defensible.
Example: say the filters give you 47,000 companies that match.
Step 3: Multiply by your yearly price
47,000 companies x $99/month x 12 months = $55.8M
That's your SAM: every customer you could reach today, at your price. It is not your SOM yet. You won't sign all 47,000.
Step 4: Go up to TAM, then down to SOM
TAM: $1.4B (every software company worldwide that could use it, at your price)
SAM: $55.8M (US, 10 to 50 employees, your price)
SOM: $257K to $1.1M (see the two approaches below)
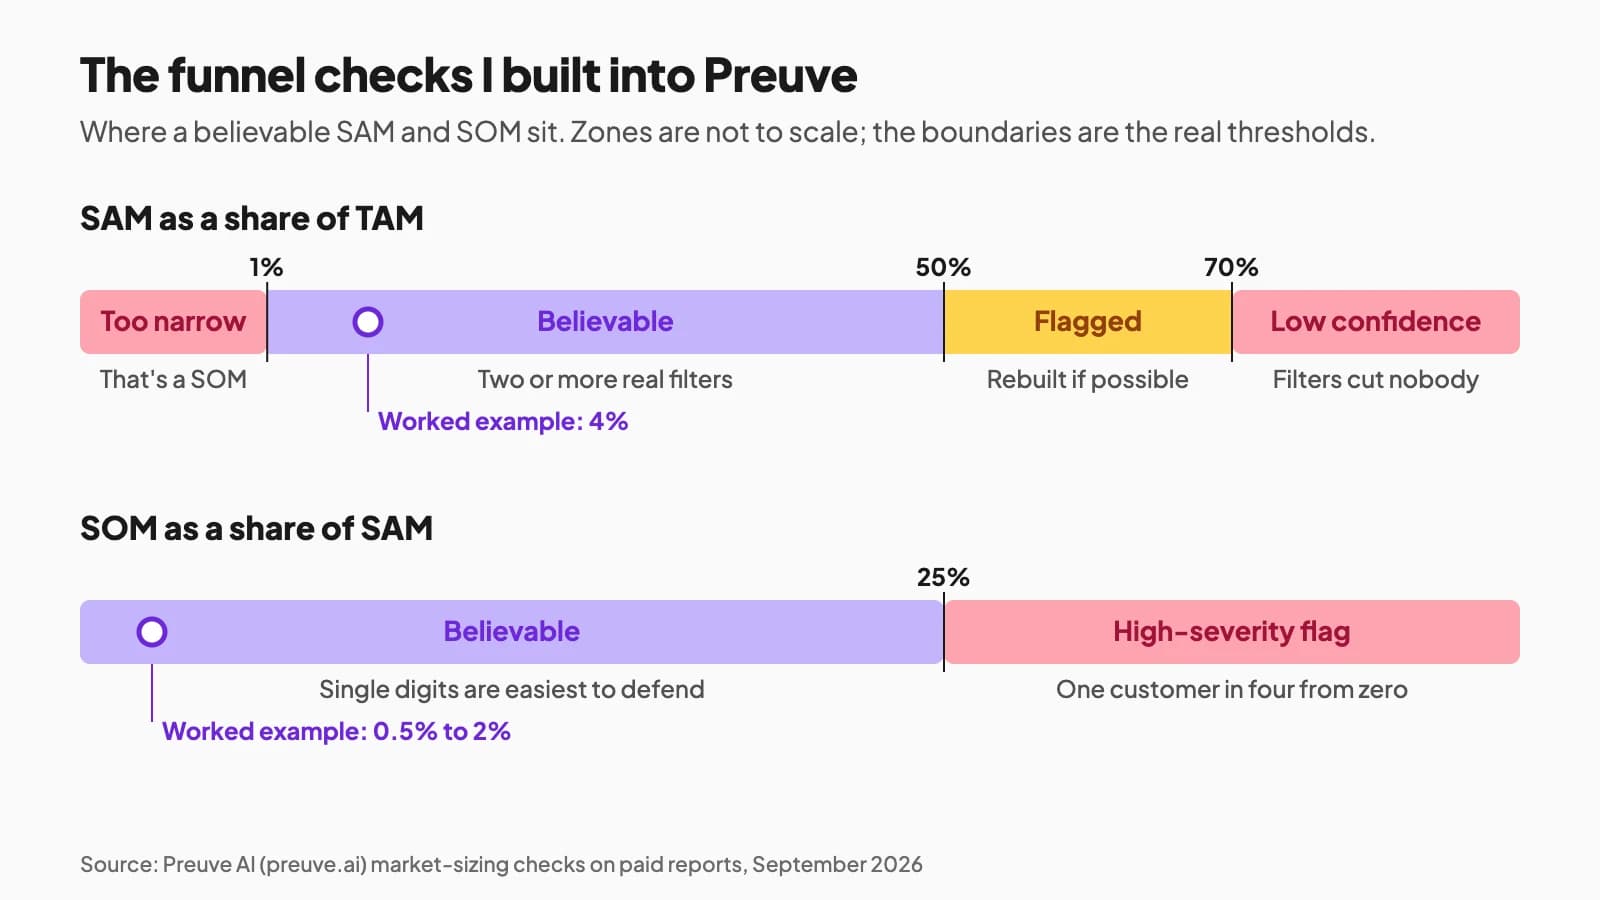
Here SAM is about 4% of TAM, which sits comfortably inside the 1% to 50% band I use as a sanity check (more on that in the red flags below).
Two Honest Ways to Size SOM
SOM is the number founders fudge most. There are two defensible ways to land it, and investors can tell which one you used.
Approach A: market-share estimation. Take a realistic slice of SAM. For most B2B software, winning 1% to 5% of SAM by year 3 is credible.
SOM = SAM × 2% = $55.8M × 2% = $1.1M
Approach B: customer-count target. Work from your actual sales capacity. How many customers can you close in 3 years given your reps, budget, and competition?
2 reps × 3 deals/month × 36 months = 216 customers
SOM = 216 × $1,188/year = $257K ARR
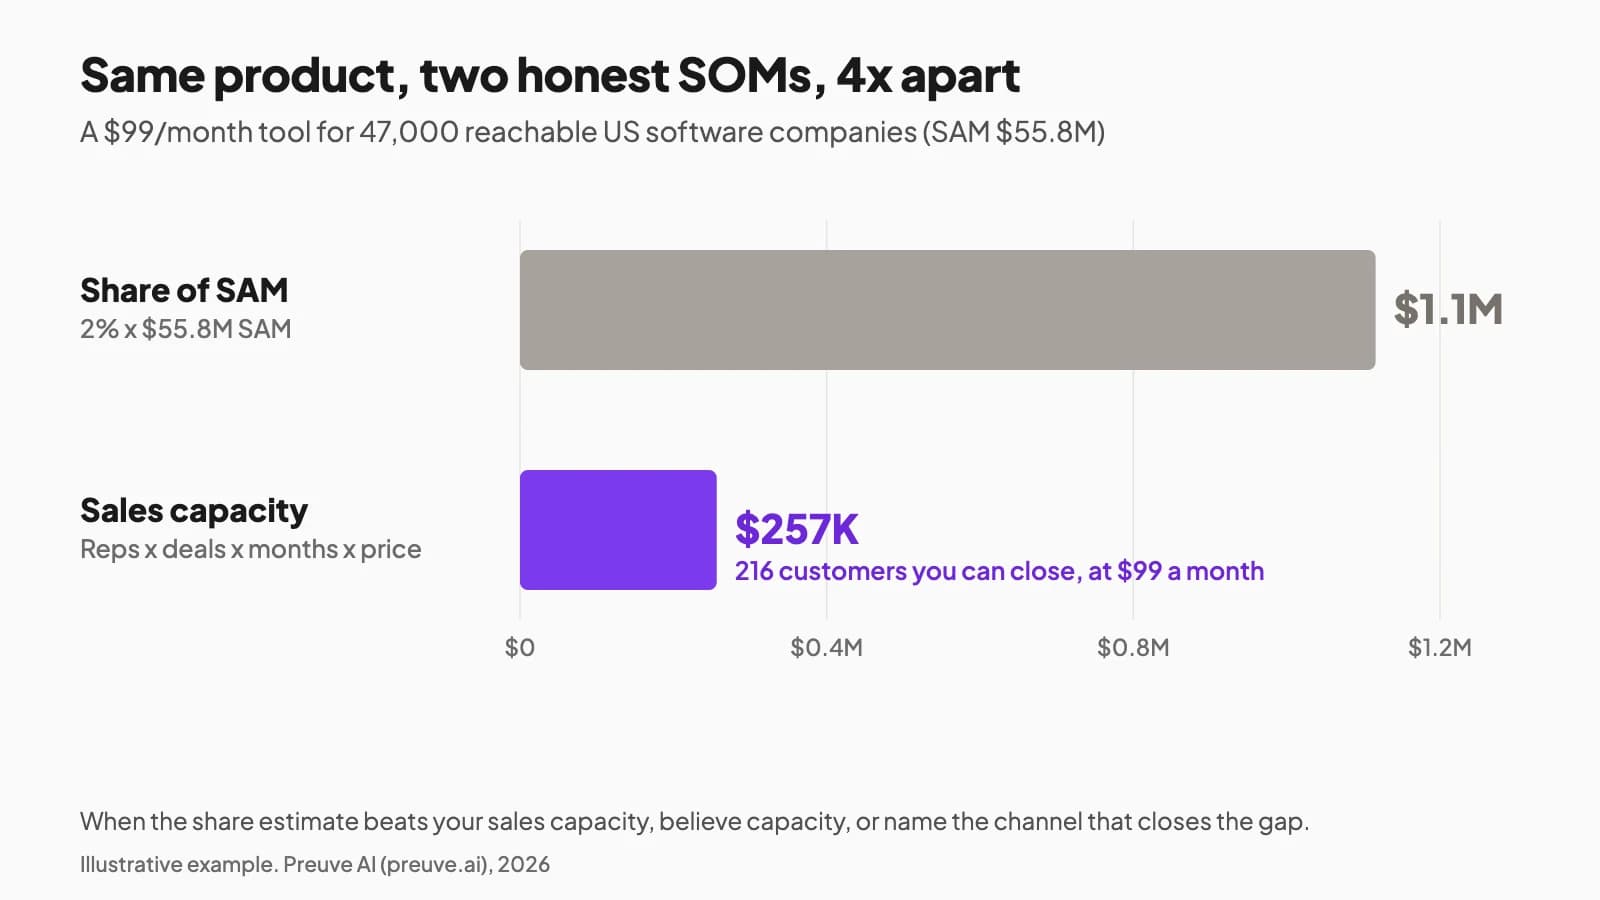
ARR means annual recurring revenue, the yearly subscription income. Notice the gap: Approach A says $1.1M, Approach B says $257K. When the share estimate is four times your capacity, believe the capacity, or name the channel that closes the gap (a partner, a marketplace listing, more reps from the round you're raising).
VCs trust Approach B more because it proves you've thought about execution. Put B on the slide and use A to check it.
Method 2: Top-Down (Use with Caution)
Start with industry data, then narrow it down. Every percentage you apply needs its own source. A share you picked yourself is still a guess, it just looks precise.
Step 1: Find the total industry size
Sources: Gartner, Statista, IBISWorld, public company filings. Open the page and check the figure is actually on it. Skip "$X billion by 2030" press releases, they're the least reliable number you can put on a slide.
Example: say an industry report puts global project management software at $6.7B.
Step 2: Filter down to your segment
$6.7B x 30% (small business segment) = $2B
$2B x 40% (US market) = $800M
$800M x 15% (cloud-native only) = $120M SAM
Step 3: Apply a realistic capture rate
$120M x 3% (3-year capture) = $3.6M SOM
Keep that capture rate in single digits. A top-down SOM at 25% of SAM tells an investor you expect to win one customer in four from a standing start.
Method 3: Value-Based
Calculate from the problem you solve.
Step 1: Quantify the pain
Example: "Companies waste 5 hours/week on manual reporting. At $50/hour average, that's $13,000/year per company."
Step 2: Count affected companies
Example: 200,000 companies in your target segment
Step 3: Apply willingness to pay
200,000 x $13,000 = $2.6B (theoretical value)
200,000 x $1,200/year (realistic price) = $240M SAM
The distance between those two lines is your pricing room. If the pain is worth $13,000 a year and you charge $1,200, price is not what will stop the sale.
Market Size Calculator: Quick Reference
| Your Price | 1,000 customers | 10,000 customers | 100,000 customers |
|---|---|---|---|
| $9/month | $108K ARR | $1.08M ARR | $10.8M ARR |
| $29/month | $348K ARR | $3.48M ARR | $34.8M ARR |
| $99/month | $1.19M ARR | $11.9M ARR | $119M ARR |
| $299/month | $3.59M ARR | $35.9M ARR | $359M ARR |
Find your price, then read across. Use the number of customers you can reach for SAM, and the number you can close in 3 years for SOM.
Free Tools to Calculate Market Size
| Tool | Best For | Cost |
|---|---|---|
| Statista | Industry-level TAM data | Free basic stats, paid plans for full data |
| Census Bureau | US business counts by size/industry | Free |
| LinkedIn Sales Navigator | Counting companies by segment | $119.99/mo (Core, monthly billing, September 2026) |
| Crunchbase | Startup/tech company counts | Free limited |
| Google Trends | Demand trajectory | Free |
| Preuve AI | Competitors and market trend (free scan); TAM, SAM, SOM (paid report) | Free scan, paid report |
One choice I made on purpose: Preuve's free scan doesn't show TAM, SAM, or SOM. A 60-second scan isn't good with this data. It can hallucinate or give exaggerated numbers that would look super bad in front of someone who knows their stuff. So the free scan gives you the market trend, and the sizing only appears in the paid report, where TAM and SAM show their source or the math behind them, and SOM is a modeled estimate.

Skip weeks of manual research
Get complete market research, sourced proof, competitor map, and pricing data for your idea instantly.
What Investors Actually Want to See
Investors don't want big numbers. They want believable numbers.
Good market size slide
TAM: $1.2B (global mid-market HR software, [analyst report, year])
SAM: $43M (US mid-market companies on legacy HR tools)
SOM: $2.2M (600 customers in 3 years, 5% of SAM)
Bottom-up validation:
- 12,000 target companies (LinkedIn count)
- $299/month average price (competitor benchmark)
- 12,000 x $3,588 = $43M
Bad market size slide
TAM: $50B (HR tech industry)
If we get 1% = $500M opportunity
The first shows work, and every figure says where it came from. The second shows you Googled "HR market size" and called it a day. I break the whole slide down in my guide to what VCs want in your market slide.
Market Size Red Flags
The last four checks below are rules I built into Preuve's paid reports, because they catch most broken market funnels before anyone reads them. Run them on your own numbers before an investor does.
"The market is $X billion"
Without segmentation, this is meaningless. Which billion? Where? Who?
"No direct competitors"
Then either the market doesn't exist, or you're not looking hard enough. Both are problems.
"We just need 1%"
The "1% of a big market" argument is a red flag for investors. It assumes distribution is free. It's not.
SAM outside 1% to 50% of TAM
Above half, your filters removed almost nobody, and TAM equal to SAM means you skipped the work. In a Preuve report, a SAM above 50% of TAM gets recomputed from at least two real filters when it can be, like region and company size, and above 70% the whole funnel is marked low confidence. Below 1%, you stacked filters until you described what you can win, which is the SOM's job.
SOM above a quarter of SAM
Nobody wins one customer in four of their reachable market within three years from zero. When SAM and SOM are both $1M or more, Preuve flags this as a high-severity contradiction. Size SOM from sales capacity instead.
A TAM from a "$X billion by 2030" release
Those headlines come from market research mills and the press-release sites that carry them. I filter those publishers out of the market news Preuve's reports are built on, because they feed made-up totals into market sizing.
A figure that isn't on the page you cite
Investors click the link. In Preuve, a TAM that doesn't appear on its cited page is labeled an estimate, and a company homepage never counts as a source.
Market Size by Startup Type
| Startup Type | Typical SOM (Year 1-3) | Notes |
|---|---|---|
| B2B SaaS (SMB) | $1M - $20M | Easier to reach, lower prices |
| B2B SaaS (Enterprise) | $5M - $50M | Harder sales, bigger contracts |
| B2C Subscription | $500K - $10M | Volume play, high churn |
| Marketplace | $2M - $30M | Network effects matter |
| Developer Tools | $1M - $15M | Bottom-up adoption |
These are my rule-of-thumb ranges for a seed-stage company with a small team, not a study. The two-rep example above lands below the first row, which is normal for a bootstrapped start. It tells you what a seed round would need to buy: more reps, or a channel that sells for you.
How to Validate Your Market Size
Numbers on paper mean nothing without validation.
Count real prospects
Build a list of 100 target companies. If you can't find 100, your market is too small or too vague.
Check competitor revenue
If the market leader does $50M ARR and there are 5 competitors, the market is probably $100-200M. Not $5B.
Talk to customers
Ask: "How much do you spend on [problem] today?" Their answers reveal willingness to pay.
Test demand
Run $100 in Google Ads. If nobody clicks on "[your solution] + software," the market might not exist.
Scan your idea
Get competitors, demand signals, and the market trend in 60 seconds.
Market Size Template
Copy this framework for your pitch deck:
MARKET OPPORTUNITY TAM: $[X]B [Source + year] Definition: [Who's included] SAM: $[X]M [Geographic/segment filter] Definition: [Your reachable market] SOM: $[X]M [Realistic capture] Definition: [What you can win in 3 years] Bottom-up validation: - [X] target companies (source) - $[X]/month price point (competitor benchmark) - [X]% realistic penetration - = $[X]M Year 3 opportunity Checks: SAM is 1-50% of TAM. SOM is under 25% of SAM.
The Real Question
Market size isn't about impressing investors with big numbers.
It's about answering: "Is this opportunity worth my next 3-5 years?"
A $2M SOM with a clear path to capture beats a $5B TAM you'll never touch.
Calculate honestly. Build accordingly.
Market size is one check among several. I wrote a full guide on how to validate a startup idea from demand to competitors.
FAQ
How do I calculate TAM SAM SOM?
TAM (Total Addressable Market) is everyone who could buy your product worldwide. SAM (Serviceable Addressable Market) is the part you can reach with your business model and geography: count those customers and multiply by your yearly price. SOM (Serviceable Obtainable Market) is what you can win in about 3 years, sized from your sales capacity or a small share of SAM. A believable funnel keeps SAM between 1% and 50% of TAM, and SOM under 25% of SAM.
How do I calculate SOM?
Multiply the number of customers you can realistically close in about 3 years by your yearly price. Get that customer number two ways: from sales capacity (reps × deals per month × months) and from a single-digit share of SAM. Use the smaller one unless you can name the channel that closes the gap. A SOM above 25% of SAM is a red flag.
How do I calculate SAM?
Count the customers you can reach today with your business model, geography, and way of selling, then multiply by your yearly price. Use countable sources such as Census Bureau business counts or LinkedIn Sales Navigator filters, and write the source next to the number. A believable SAM usually sits between 1% and 50% of TAM.
What is a good market size for a startup?
It depends on the money you want. For a venture round, investors look for a market where the company could plausibly reach $100M+ in yearly revenue, so a SAM several times that. For a bootstrapped company, a SOM of a few million with weak competition can be plenty. At any stage, what matters is that the SOM is believable and every figure has a source.
How do you calculate market size for a new product?
Use bottom-up analysis: define your specific customer (industry, size, geography), count how many exist using LinkedIn or Census data, and multiply by your price. That gives your SAM. Your SOM is the part of it you can close in 3 years. Validate both by checking competitor revenue and asking potential customers what they spend on the problem today.
What's the difference between TAM and market opportunity?
TAM is theoretical (everyone who could buy). Market opportunity is practical (what you can actually capture). A $10B TAM with 50 entrenched competitors has less opportunity than a $500M TAM with one weak incumbent. Focus on SOM, not TAM.
How accurate are market size calculators?
Market size estimates are directionally accurate, not precise. Bottom-up calculations based on countable customers are more reliable than top-down industry reports. Always validate with real-world signals: competitor revenue, customer interviews, and demand testing.
What market size do VCs look for?
Most VCs targeting 10x returns need markets where a startup could reach $100M+ ARR (yearly recurring revenue), which takes a SAM several times larger. Your 3-year SOM can be small: investors judge it on how believable it is, not on its size. Team, timing, and traction weigh as much as the market.
How do I calculate market size if there's no existing data?
Look at adjacent budgets. If you're solving a problem companies currently handle with spreadsheets and interns, estimate how much that costs them annually. If you're replacing an existing tool, use that tool's pricing as your anchor. The market exists even when the reports don't.
Should I use top-down or bottom-up market sizing?
Both. Show top-down for context ("the overall market is $X according to Gartner"), then bottom-up for credibility ("here is how I counted my serviceable market"). When the two numbers roughly align, you earn investor trust. When only top-down exists, investors assume you skipped the work. Check that the top-down figure actually appears on the page you cite.
Is there a market size template I can use?
Yes. The template in this guide works for most pitch decks. For a version with real numbers, Preuve AI's paid report sizes TAM, SAM, and SOM for your idea. TAM and SAM show their source or the math behind them, and SOM is a modeled estimate. The free scan shows the market trend only.
My market seems too small. Should I pivot?
Not necessarily. A $30M SOM can build a great business, just maybe not a venture-backed one. Be honest about what kind of company you're building. If you want VC money, you'll need to show a path to a bigger market (new segments, geographies, or products). If you're bootstrapping, a focused $30M market with weak competition might be exactly right.
Cite this page
Last updated September 28, 2026
Forat, V. (2026, September 28). TAM SAM SOM: How to Calculate Your Market Size. Preuve AI. https://preuve.ai/blog/market-size-calculator
Forat, Vincent. “TAM SAM SOM: How to Calculate Your Market Size.” Preuve AI, 28 Sept. 2026, preuve.ai/blog/market-size-calculator.
Forat, Vincent. “TAM SAM SOM: How to Calculate Your Market Size.” Preuve AI. September 28, 2026. https://preuve.ai/blog/market-size-calculator.
@misc{forat2026-market-size-calculator,
  author = {Forat, Vincent},
  title = {{TAM SAM SOM: How to Calculate Your Market Size}},
  howpublished = {Preuve AI},
  year = {2026},
  month = sep,
  url = {https://preuve.ai/blog/market-size-calculator},
  note = {Last updated September 28, 2026}
}
Vincent
5 years in B2B growth, building Preuve AI in public. 82% of ideas it scores aren't ready, the point is finding out in 10 minutes, not 3 months.
Follow on X →
Building is expensive. Validation is free.
Run your idea through 10 AI agents before you write a line of code. Every claim source-linked.