The short answer
TAM is the total addressable market: the yearly revenue if every possible buyer paid you. SAM, the serviceable addressable market, is the part your product, price and channels can reach. SOM, the serviceable obtainable market, is the part you can win in about three years. Each one is a buyer count times the annual price per buyer. A believable set keeps SAM at or under half of TAM and SOM at or under a quarter of SAM, the two ratios Preuve’s paid report checks.
Key takeaways
- One formula, three buyer counts: TAM, SAM and SOM are each a number of buyers times the annual price per buyer. Only the buyer count shrinks from one layer to the next, so every layer can be rebuilt from two inputs.
- Two ratio checks flag a market slide that does not add up: A SAM above 50% of TAM means the filters barely narrowed the market, and a SOM above 25% of SAM describes a market leader, not a first foothold.
- SOM has two methods, and the smaller one wins: Sales capacity gives a customer count, times the annual price gives revenue. Compare that in dollars with a single-digit share of SAM and keep the lower figure, unless you can name the channel that closes the gap.
- A sourced small SOM beats an unsourced big TAM: An unsourced TAM above $10 billion usually reads as a top-down analyst figure. A counted buyer base with a named source is a number an investor can check.
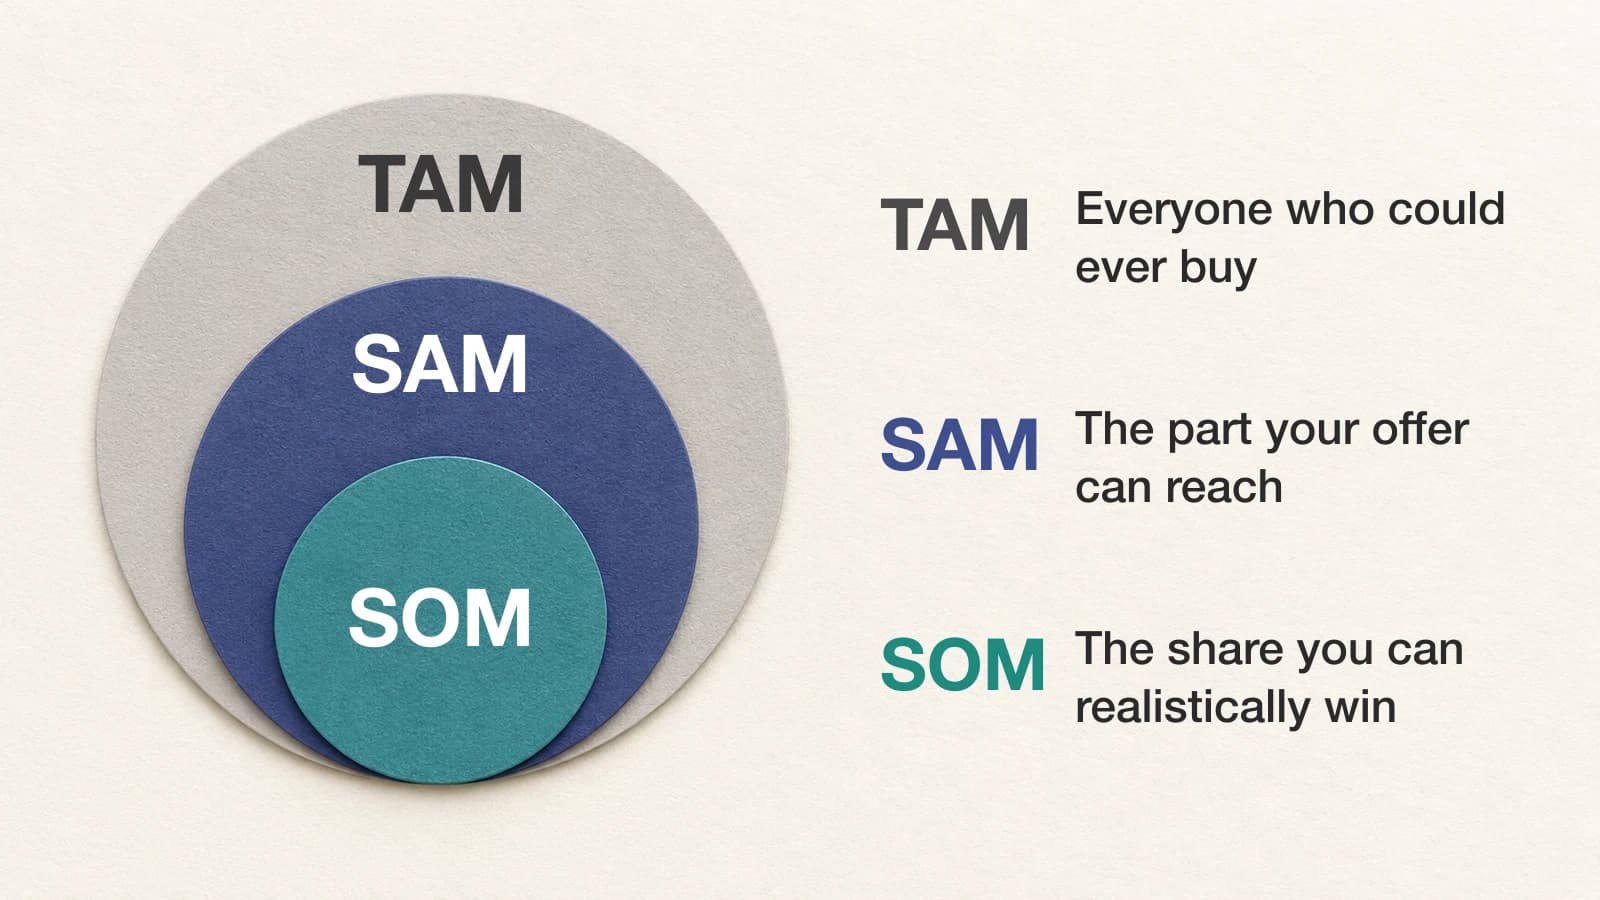
TAM, SAM, and SOM are three estimates of the same market: the total addressable market (TAM) is everyone who could ever buy what you sell, the serviceable addressable market (SAM) is the part of the market that your product, price and channels can reach, and the serviceable obtainable market (SOM) is the part of the market you can realistically obtain in about three years. Investors mostly scrutinize the SOM because it needs to match your revenue plan.
Use the TAM SAM SOM calculator below to check whether your market size passes the two ratio checks. I also included examples of how to calculate TAM, SAM, and SOM using publicly available buyer counts. And to calculate SOM, I show how Preuve's market research does it. For this step, I trust the capacity method more.

Will your idea survive the market?
Preuve AI runs 10 agents against live market data and links every claim to a source. Free analysis in 60 seconds.
What are TAM, SAM and SOM?
You can express TAM, SAM, and SOM in yearly revenue. To do so, you need to calculate how many buyers you can sell to and multiply it by the yearly price for a single buyer. For the running example, I assumed a software subscription for small software companies priced at $99 per month, or $1,188 per year.
Total addressable market (TAM)
TAM: How much yearly revenue you'd make if everyone that could possibly buy your product bought it from you, and you had no competitors. It's impossible to capture your TAM: it's the maximum.
TAM = every possible buyer × annual price per buyer
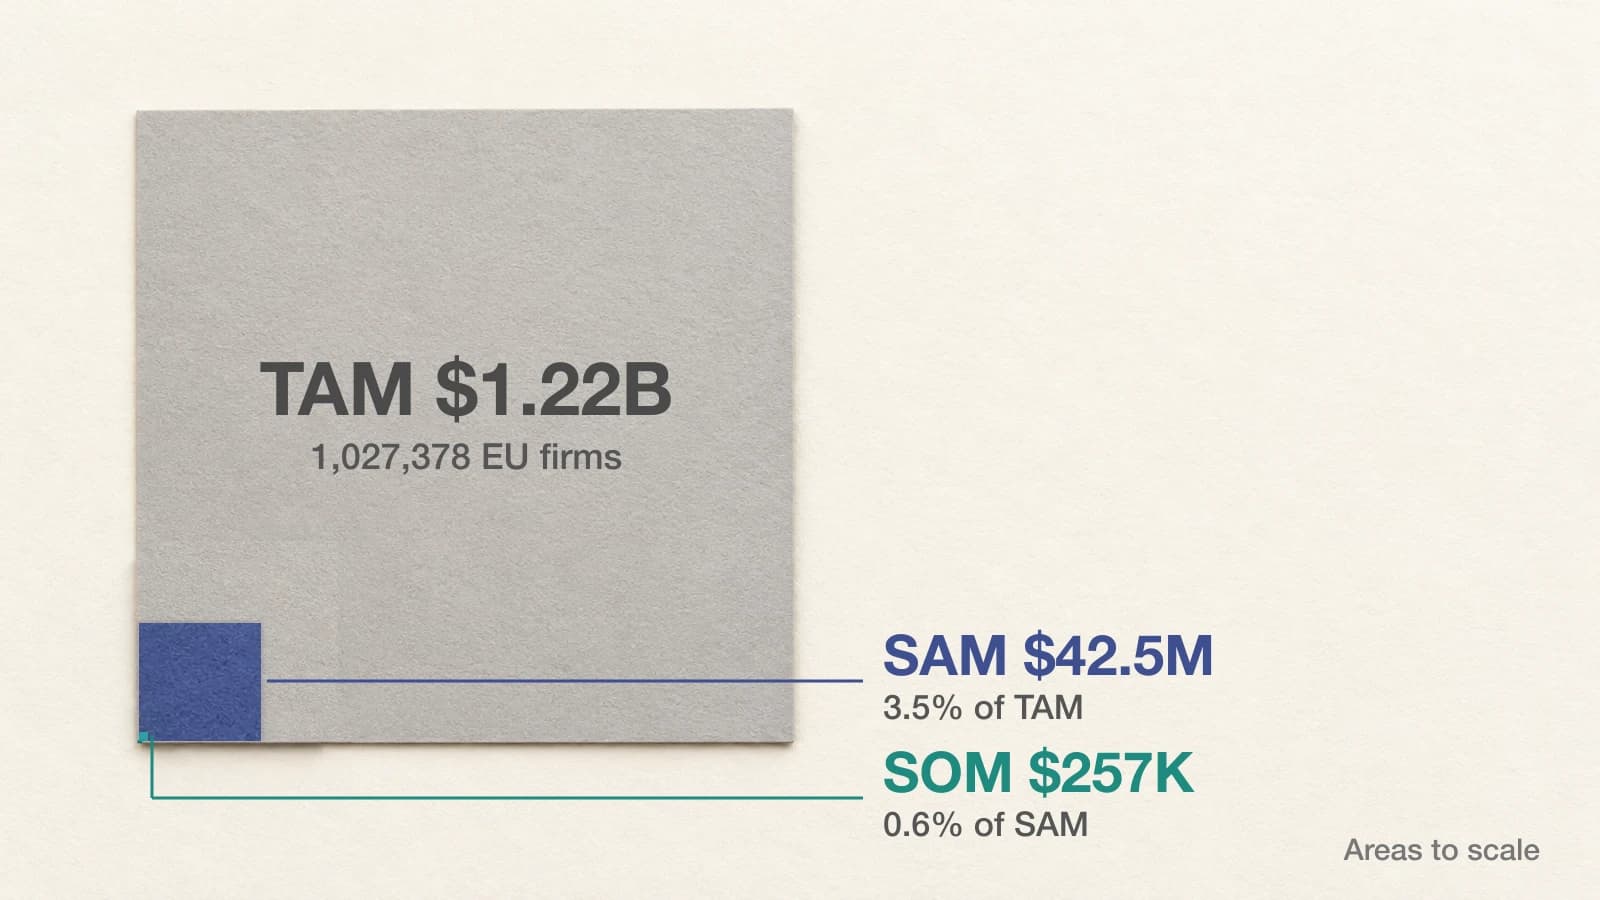
For the example, I use the number of companies that offer computer programming and consultancy services in the EU, which is 1,027,378 in 2024, according to Eurostat. The TAM is therefore equal to 1,027,378 × $1,188 = about $1.22 billion per year.
Serviceable addressable market (SAM)
SAM: How much of your TAM you can reach today with your product, given your pricing and sales channel. To find your SAM, apply filters to the TAM, e.g., geography, customer segment, company size, sales channel.
SAM = buyers left after your filters × annual price per buyer
If you only target companies with 10 to 49 people, there are 35,778 companies. Your SAM is then equal to 35,778 × $1,188 = about $42.5 million per year.
Serviceable obtainable market (SOM)
SOM: How much of your SAM you can take in about three years, given the competition and the number of deals you can close. According to CRV's market size guide (September 1, 2026), you should calculate how much of the market you can take in three to five years. I went for the low end of this range because your SOM should match your revenue plan for year 3.
SOM = customers you can close in about 3 years × annual price per buyer
If you have two sales reps that can each close three deals per month, you can close 36 × 2 × 3 = 216 deals in three years. Assuming no churn, your yearly recurring revenue at the end of year 3 is 216 × $1,188 = about $257,000.
TAM vs SAM vs SOM: what’s the difference?
TAM: How big is the entire category? SAM: How much of the TAM can your product reach today? SOM: How much of the SAM can you close in about 3 years, given competition and the sales team you can afford?
| Layer | Question it answers | Formula | What filters it | Time horizon | Who reads it |
|---|---|---|---|---|---|
| TAM | How big can this category get? | Every possible buyer × annual price | Nothing, only the category definition | Today, or 5+ years out | Investors judging the ceiling |
| SAM | How much can my product reach? | Buyers after filters × annual price | Region, segment, size, channel, product fit | Today | Investors and your go-to-market plan |
| SOM | How much can I win? | Customers closed × annual price | Competitors, sales capacity, budget | About 3 years (3 to 5 for CRV) | Investors checking your revenue plan |
Source: definitions and formulas as used in this guide; SOM horizon from CRV, How Investors Evaluate Market Size, published September 1, 2026, read October 24, 2026; the 5+ year TAM horizon from Pear VC’s Market Sizing Guide, read October 24, 2026.
TAM SAM SOM calculator
Enter the number of buyers for your TAM and SAM, and your price per buyer per year. For SOM, enter the number of sales reps you have, the number of deals each rep can close per month, and the number of months (default 36). You can also calculate SOM as a percentage of your SAM. The calculator shows the SOM in both cases, and keeps the smaller SOM.
Note: The thresholds used in this calculator are those used in Preuve's paid report. If your SAM is greater than your TAM, it means you made a mistake. If your SAM is greater than 50% of your TAM, it means you may not have applied enough filters. If your SOM is greater than 25% of your SAM, it means you're not using a beachhead strategy. If your TAM is greater than $10 billion, you should show where you got the data, otherwise it will likely be assumed to be a top-down calculation.
Bar length is logarithmic: each 20% of the width is a tenfold step down from TAM.
TAM
Total addressable market
$1.22B
SAM
Serviceable addressable market
$42.5M
3.5% of TAM
SOM
Set by sales capacity
$257K
0.6% of SAM
Sales capacity is 216 customers times your yearly price, $257K. A 2% share of SAM gives $850K. SOM keeps the smaller one: sales capacity.
No warnings. SAM is 3.5% of TAM and SOM is 0.6% of SAM, both inside the limits Preuve’s paid report checks.
Want each of these figures researched, with a cited source or an estimate label on every one? That is what the paid Preuve report does.
How to calculate TAM
The best way to calculate your TAM is bottom-up, that is, figure out how many potential buyers there are, and multiply it by the annual price you charge per buyer. The main difficulty here is figuring out how many potential buyers there are. Where can you get this information? It depends, but here are a few starting points:
- US companies: Statistics of U.S. Businesses by the Census Bureau has the number of companies that have at least one paid employee, broken down by industry and by employment size. County Business Patterns by the same agency has the number of locations, but that will overcount the number of buyers if a company has multiple locations.
- EU companies: Enterprise Statistics by Size Class from Eurostat has the number of enterprises by activity and by number of people employed, both by country and for the EU as a whole.
- Startups: If you're selling to startups, you can use Crunchbase.
You can also use a top-down number if you can find one published somewhere, but only as a sanity check against your bottom-up number, not as the only number you have. Preuve's paid report flags your TAM if it is unsourced and greater than $10 billion, at which point it's likely you're using a top-down number from an analyst, and there's no way to sanity check the revenue projections you're building on top of that number. If you have a sourced $12 billion TAM for a big market, you'll pass the check just fine.
How to calculate SAM
SAM is the number of buyers in your TAM, minus the ones you exclude with each of the filters below, times the annual price you charge per buyer. The filters you can use to narrow down your TAM into your SAM are:
- Region: what countries can you sell to, legally and in a language you can provide sales in?
- Segment: what kind of companies can your product be useful for?
- Size: what size companies (by headcount) are you targeting?
- Channel: what kind of companies can you reach given your sales motion?
- Product: what kind of companies can your product work for, given the way they set things up?
Let's look at an example of calculating a SAM. Say you have a tool you're selling for $99 a month, and you decide that you're only going to sell to EU companies with between 10 and 49 people. You can look at the Eurostat data (for 2024) and see that there are 1,027,378 firms in computer programming and consultancy, but only 35,778 firms with between 10 and 49 people. You can also assume that firms with 2 to 9 people (160,621 of them) are usually too small to pay $99 a month for your tool. This gives you a SAM of $42.5 million, which is 3.5% of your TAM.
Preuve's paid report only checks for an upper limit on your SAM, which is 50% of your TAM. If you're not excluding at least half of your TAM with your region, segment, and size filters, then your SAM is really just a second TAM. It doesn't check for a lower limit on your SAM.

Skip weeks of manual research
Get complete market research, sourced proof, competitor map, and pricing data for your idea instantly.
How to calculate SOM
There are two ways to calculate your SOM from your SAM, and both ways calculate your SOM in dollars. Whichever way gives you a lower SOM is the one to go with (unless you can explain why you'll be able to close the gap between the two).
- Sales capacity. Number of sales reps you have × number of deals each rep can close per month × number of months = number of customers you'll have by the end of 3 years. Multiply this by your annual price per buyer to get your SOM. So if you have 2 reps and they each can close 3 deals a month, you'll have 216 customers by the end of 3 years. If your annual price per buyer is $1,188, that's an annual revenue of $256,608 by the end of 3 years.
- Share of SAM. Pick a low single-digit % of your SAM (which should already be in dollars), and that's your SOM. So if your SAM is $42.5 million and you pick 2%, your SOM will be about $850,000 in annual revenue.
Note that in this example, your share of SAM is much higher (by more than 3x) than your sales capacity. In this case, you should go with your sales capacity, unless you can explain how you'll be able to close the gap (e.g. selling through a partner, listing on a marketplace, raising a round to hire more reps).
What is a good SOM percentage?
Your SOM should be a low single-digit % of your SAM for your first 3-year business plan. According to Pear VC's market sizing guide, tech companies at IPO typically have between 0.1% and 2% of their addressable market, so aiming for 2% of your SAM in 3 years is already ambitious. Preuve's paid report checks if your SOM is more than 25% of your SAM, in which case you're assuming you'll be the market leader from the start, rather than trying to capture a beachhead (i.e. a market you can get a foothold in first). In the example above, the SOM of $257,000 is 0.6% of the SAM.
Preuve's own research rarely uses the capacity method. Almost every SOM it records is a share of SAM. Here's the count in the table.
| Signal | Number | Source |
|---|---|---|
| Paid reports in the window | 168 | Preuve D1 |
| Reports that record the SOM method | 98 | Preuve D1 |
| SOM sized as a share of SAM | 92 of 98 (94%) | Preuve D1 |
| SOM built bottom-up | 6 of 98 | Preuve D1 |
| SAM above 50% of TAM before the recount | 30 of 168 (18%) | Preuve D1 |
| SAM above 50% of TAM warning after the recount | 1 of 168 | Preuve D1 |
| SOM above 25% of SAM warning | 1 of 168 | Preuve D1 |
Source: Preuve paid reports created August 24 to October 24, 2026, read October 24, 2026. Counts market sizing researched by Preuve for ideas founders chose to scan, one report each.
I would explain the 94% by the idea that most of the research relies on publicly available data, and is often conducted before the company is even created. Therefore the research can usually only compute the share of SAM, because only you know your plan of sales reps or deals per month.
Investors also know the difference. For instance, the VC Pear surveyed 30 other VCs and found that Series A VCs were more interested in a bottom-up computation of revenues (like your sales capacity) than in a SOM that is a share of TAM or SAM. Make sure to communicate your sales capacity in your slides.
TAM SAM SOM example: one B2B software tool, start to finish
Product: a software tool sold for $99 a month to software companies (so each buyer spends $1,188 a year). Here I had to limit the TAM to the EU to have a table with the size of the whole computer programming and consultancy category in this region. The region is therefore the first filter. If I had added the number of software companies in the US (from the Census Bureau) and in other countries (from the national statistics offices of these countries), I could have estimated a worldwide TAM.
| Layer | Buyers | Arithmetic | Result |
|---|---|---|---|
| TAM | 1,027,378 EU firms in computer programming and consultancy | 1,027,378 × $1,188 | $1.22 billion |
| SAM | 20,789 firms with 10 to 19 people + 14,989 with 20 to 49 | 35,778 × $1,188 | $42.5 million (3.5% of TAM) |
| SOM, capacity | 2 reps × 3 deals a month × 36 months = 216 customers | 216 × $1,188 | $257,000 (0.6% of SAM) |
| SOM, share | 2% of SAM, about 716 customers | $42.5 million × 2% | $850,000 |
Source: Eurostat, Enterprise statistics by size class and NACE Rev. 2 activity (sbs_sc_ovw), EU 27, 2024, NACE J62, read October 24, 2026 (the exact query). Counts enterprises; the price, reps and deal rate are this example’s assumptions.
The two conditions are met, because the SAM is only 3.5% of the TAM (the condition is under 50%) and the SOM presented in the slide ($257,000) is only 0.6% of the SAM. Note that I didn't factor out churn in the computation of the 216 clients, which are therefore an upper bound. Also, in the TAM I still have all the 820,700 one-person firms. I also didn't factor out IT consultancies from the SAM. A real market sizing would factor all these out (the one-person firms are factored out by the size filter, and the IT consultancies can be factored out by the segment filter).
A second example: a consumer app
Product: an app for meal planning, sold for $5 per month to people living alone (so each buyer spends $60 a year). According to the Census Bureau, in 2025, there were 39.7 million one-person households in the US, which represents 29% of all the households (which puts the total near 137 million).
- TAM: all households, which is 137 million × $60 = about $8.2 billion.
- SAM: one-person households, which is 39.7 million × $60 = about $2.38 billion. It is 29% of the TAM.
- SOM: for a consumer product, you won't have sales reps. You will however have a budget to spend on advertising. Let's say you budget $450,000 over the first 3 years of the company, and that you can buy a subscriber for $45 (this is an assumption, you will have to validate it). Your SOM is therefore 10,000 subscribers, which represents $600,000 per year, without factoring out churn (which can be important for a cheap app).
In comparison, if you take 0.5% of the SAM, you obtain $11.9 million, which is 20 times more.
What investors check on a TAM SAM SOM
Investors expect you to be able to present the number of buyers for each of the TAM, SAM, SOM and multiply it by the price. The VC CRV presents a list of what not to do to keep credibility with them. The VC Pear asked 30 VCs what they wanted, and recommends clarifying the methods you are using (because other people don't necessarily use the same definitions as you).
Finally, if you buy Preuve's paid report, it checks (in code) the following:
- If the SAM is more than 50% of the TAM, the research gets one attempt to recount the SAM from at least two real and quantified filters. If it fails, the report displays a warning and marks the market section as low confidence.
- If the SAM is more than 70% of the TAM, it is always considered structurally invalid.
- If the SOM is more than 25% of the SAM, it produces the most severe warning for the market, and caps the coherence score of the report at 69/100. The two other warnings cap it at 89/100.
- If the report doesn’t find the figure on the page it cites, it’s labeled an estimate, not a quote.
- If the report links to a site’s homepage instead of the page with the figure, it reduces the level of confidence in your market section.
In a count of 168 paid reports from August 24 to October 24, 2026, 30 of them had a SAM above 50% of the TAM. After the recount, 29 of them were corrected and only one still displays the alert. It’s better to display it than to have a wrong recount of your TAM/SAM/SOM.
Bottom-up vs top-down
As stated in the guide from CRV, showing a top-down market size on its own is not a good idea, because investors are skeptical of it. They’ll look at your bottom-up model instead. It’s a good idea to use a published market size to confirm your bottom-up market size.
I agree with CRV. You should use the two methods to calculate your market size and check if there’s a big difference between the two. If you want to know how to calculate it with 3 methods and where to find free sources, you can read my full guide on how to calculate your market size.
Putting TAM, SAM and SOM on a slide
You should display your TAM/SAM/SOM, the number of buyers for each market and the source you use to find each number. For your SOM, you should add the method you use to calculate it (capacity or market share) and it should be equal to your revenue run rate at the end of year 3 in your business plan. If you want more details on how to display it on your slide, you can check this guide on how to create your market slide for VCs.
What if your 35,778 firms don’t want to pay $99 a month for your product? Even if you find your number of firms in reliable sources (Eurostat, Census Bureau, etc.), the price, your deal rate and your cost to acquire a subscriber ($45 in my example) are based on your guesses. The best way to know if your customers are ready to pay $99 a month is to ask them.
If you want to know how you can validate your startup idea, you can read this guide.
Disclosure: I founded Preuve, and the paid report below is what it sells. I have created a free tool that can scan more than 60 different live data sources in less than a minute to give you a score on your startup idea and the main risks you should know about. Even if it doesn’t give you the market size, it can give you an idea about the trend of your market. If you want to know your TAM/SAM/SOM, you can order a paid report that will calculate it for you in about 10 minutes with the source for each number (or a label if it’s an estimate). This report will run all the checks mentioned above.
Methodology and sources
| Source | What we used | Size or date | Limitation |
|---|---|---|---|
| Preuve paid reports (D1 database) | How each SOM was built (share of SAM or bottom-up), how many market sizes came back with a SAM above 50% of TAM and were recounted, and how many still carry the SAM and SOM warnings | 168 paid reports created August 24 to October 24, 2026; 98 of them record the SOM method | Market sizes researched by Preuve for ideas founders chose to scan, not founders’ own slides; ideas skew early stage |
| Preuve market-sizing checks (source code) | The 50% SAM/TAM and 25% SOM/SAM ceilings, the SAM recount, the $10 billion unsourced TAM note, the 70% block, the homepage and value-not-on-page rules, the coherence score ceilings | Code read October 24, 2026 | Thresholds are product choices calibrated on Preuve reports, not an industry standard |
| Eurostat, Enterprise statistics by size class and NACE Rev. 2 activity (sbs_sc_ovw) | Number of EU enterprises in computer programming, consultancy and related activities (NACE J62), total and by persons employed, for the worked example | EU 27, reference year 2024, dataset updated September 30, 2026, read October 24, 2026 | Counts enterprises in one activity class, so it includes IT consultancies and one-person firms; EU only |
| US Census Bureau, America’s Families and Living Arrangements 2025 tip sheet | 39.7 million one-person households, 29% of all US households, for the second example | Current Population Survey ASEC 2025, released December 2, 2025, read October 24, 2026 | Survey estimate with sampling error; the total household count is derived from the two figures |
| US Census Bureau, County Business Patterns | Named as a counting source for US business locations by industry and employment size | Program page read October 24, 2026 | Counts establishments (locations) with paid employees, not firms, so one-person companies are missing |
| US Census Bureau, Statistics of U.S. Businesses | Named as the counting source for US firms by employment size | Program page read October 24, 2026 | Firms with paid employees only |
| CRV, How Investors Evaluate Market Size | SOM horizon of three to five years, SOM as the most scrutinized layer, the mistakes that cost credibility, the top-down vs bottom-up comparison | Published September 1, 2026, read October 24, 2026 | One fund’s view |
| Pear VC, Market Sizing Guide | Survey of 30 VCs: Series A preference for a bottom-up revenue build over a percentage share, the advice to state the method, the 5+ year horizon, and the 0.1% to 2% share tech companies hold at IPO | Read October 24, 2026; survey date not stated on the page | Small survey, investor locations and survey date not stated |
FAQ
What does TAM SAM SOM stand for?
TAM stands for total addressable market, SAM for serviceable addressable market (sometimes serviceable available market) and SOM for serviceable obtainable market. TAM is everyone who could ever buy, SAM is the part your product, price and channels can reach, and SOM is the part you can realistically win in about three years.
What is a good SOM percentage?
For a first three-year plan, a low single-digit percentage of SAM. Pear VC notes that tech companies at IPO typically hold only 0.1% to 2% of their addressable market. Preuve flags any SOM above 25% of SAM, because that share describes a market leader rather than a first foothold. Check the percentage against sales capacity too: customers you can close in three years times the annual price. Keep the smaller of the two figures.
Can SAM be bigger than TAM?
No. SAM is a filtered part of TAM, so it can never exceed it. A SAM larger than TAM means the two were measured on different bases, for example TAM in one region and SAM in another, or TAM at one price and SAM at another. A SAM above half of TAM is also a warning sign: the filters for region, segment, size or channel removed less than half the buyers.
Is TAM SAM SOM yearly revenue?
Yes, by convention. Each layer is the number of buyers times the annual revenue per buyer, so each is a yearly figure. A monthly price is multiplied by 12 first. Marketplaces should use the revenue they keep, their take, not the total value of transactions that pass through them.
What is SOM in business?
SOM, the serviceable obtainable market, is the yearly revenue a company can realistically win from its serviceable market within about three years, given its competitors and its capacity to sell. It is the layer investors push on hardest, because it has to match the revenue line of the financial plan.
How do you calculate TAM SAM SOM for a startup?
Count buyers, then multiply by the annual price. TAM: every possible buyer times the annual price. SAM: the buyers left after the filters that apply to you (region, segment, company size, channel) times the same price. SOM: sales reps times deals per rep per month times months gives a customer count; times the annual price gives revenue. Compare it with a single-digit share of SAM and keep the smaller figure.
Is TAM SAM SOM the same as market size?
Market size usually means the TAM, the whole yearly revenue available in a defined market. TAM SAM SOM splits it into three nested layers. For a $99 a month tool sold to EU software firms, the TAM is about $1.22 billion, while the $42.5 million SAM and the $257,000 SOM show what one company can reach and win.
Cite this page
Last updated October 30, 2026
Forat, V. (2026, October 30). TAM, SAM and SOM Explained. Preuve AI. https://preuve.ai/blog/tam-sam-som
Forat, Vincent. “TAM, SAM and SOM Explained.” Preuve AI, 30 Oct. 2026, preuve.ai/blog/tam-sam-som.
Forat, Vincent. “TAM, SAM and SOM Explained.” Preuve AI. October 30, 2026. https://preuve.ai/blog/tam-sam-som.
@misc{forat2026-tam-sam-som,
  author = {Forat, Vincent},
  title = {{TAM, SAM and SOM Explained}},
  howpublished = {Preuve AI},
  year = {2026},
  month = oct,
  url = {https://preuve.ai/blog/tam-sam-som},
  note = {Last updated October 30, 2026}
}
Vincent
5 years in B2B growth, building Preuve AI in public. 82% of ideas it scores aren't ready, the point is finding out in 10 minutes, not 3 months.
Follow on X →
Building is expensive. Validation is free.
Run your idea through 10 AI agents before you write a line of code. Every claim source-linked.